
What’s New in Business Central 2025 Release Wave 2
The Autumn brings the second major release of the year for Business Central, as part of the 2 wave annual update cycle. Here we look at the highlight features.
 Jesse Lawrence
In a sector still recovering from the effects of COVID-19 and Brexit, data-driven decision-making is essential to remaining competitive.

Data visualisation tools play a pivotal role in this by transforming complex data into easy-to-understand visuals, enabling you to make informed decisions swiftly. These tools not only enhance operational efficiency but also boost investor confidence by providing clear, actionable insights.
Utilising advanced visualisation techniques, you can interpret vast amounts of data, allowing you to quickly identify trends and potential issues. Interactive visualisation tools, such as Microsoft Power BI, utilise real-time analytics and enable more dynamic decision-making processes. This form of business intelligence (BI) helps you stay on top of market demands and production metrics.
Investors are increasingly looking for businesses that leverage technology to maintain transparency and efficiency. By adopting modern data visualisation tools, you demonstrate a commitment to cutting-edge practices and robust data-driven strategies. This transparency not only builds trust with your stakeholders but also showcases your ability to strategically analyse and adapt to market changes swiftly.
You need effective data visualisation to gain insights and make informed decisions. By presenting information in visual formats, you can better understand complex data.
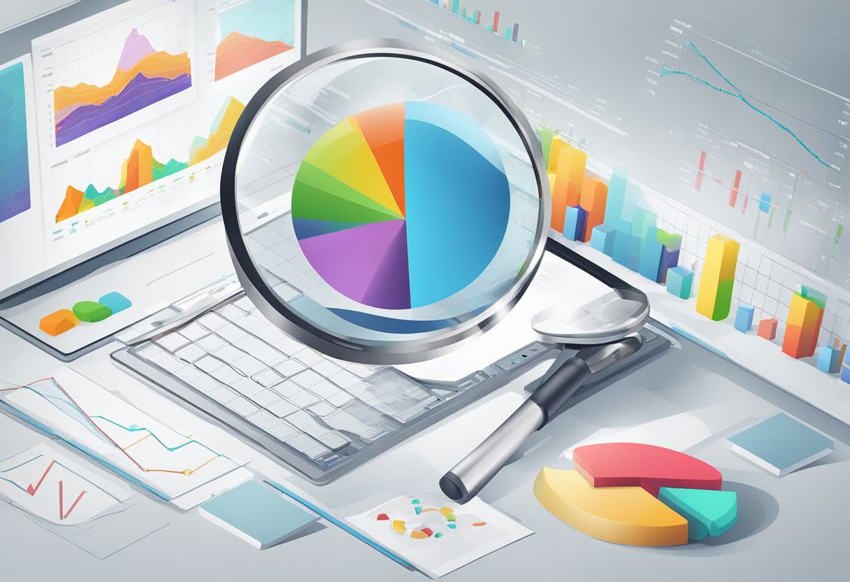
By using visual representations like charts, graphs and heat maps, you can make data more understandable. These powerful tools simplify large datasets, helping you see trends, patterns and anomalies. For business users, this means quicker and better decision-making. When you transform raw data into comprehensible visuals, you avoid misinterpretation and save time.
These visualisation options make true business intelligence much more achievable. They enable you to present data in a way that's easy to interpret. As a result, your team can immediately identify important information without sifting through endless numbers or rambling text. This enhanced comprehension leads to increased efficiency and better strategies.
Interactive dashboards are a pivotal aspect of data visualisation. They give you real-time insights into various metrics, offering a dynamic view of your business operations. This interactivity keeps investors informed and confident about your business performance.
By using these dashboards, you provide a clear picture of your company's financial status and operational achievements. Investors can interact with the data, drill down into specific details, and get answers to their questions promptly. This transparency builds trust and demonstrates your commitment to data-driven decision-making.
These tools also allow you to showcase your business’s agility and responsiveness. Investors appreciate seeing how you can quickly adapt to market changes, leading to increased investor confidence and potential funding opportunities.
Understanding which data visualisation tools to use can significantly impact investor confidence in the manufacturing sector. The following sections will explore specific tools and their detailed insights into how they aid in this regard.
With its AI-driven capabilities and integration with tools both inside and outside of the Microsoft workspace, Power BI is a powerful tool manufacturers can use to visualise and drill down into key operating data.
Power BI allows you to bring all your data together, offering an accurate single version of the truth. Its integration into commonly used apps, like Microsoft Outlook, means users can benefit from its insights at any given opportunity.
It'll come as no surprise to users of Microsoft's suite of business applications that Power BI is protected by Microsoft's market-leading security features. In addition to robust existing features, you can also add your own to ensure your users aren't accidentally sharing sensitive data.
Google Charts is a powerful and flexible tool for visualising data. It provides a wide range of chart types, including line charts, pie charts, and geo charts, making it easier to represent various forms of data effectively.
By allowing real-time data updates, Google Charts ensures that investors can see the latest information, and allows stakeholders to make informed decisions quickly. Additionally, its interactive dashboards enable users to drill down into specific data points, offering a deeper understanding of the metrics that matter most.
Integration with other Google services like Google Analytics enhances the comprehensiveness of data representation. With customisation options for colours, fonts and chart types, Google Charts offers a tailored experience that keeps stakeholders well-informed and confident in their investment choices.
Zoho Analytics is another robust data visualisation tool that excels in delivering detailed insights. It supports a wide range of data sources, including spreadsheets, cloud storage and databases, making it versatile for a range of data integration needs.
One standout feature of Zoho Analytics is its ability to create complex reports and dashboards with ease. Investors can view detailed analytics through various types of visualisations like bar charts, heat maps, and pivot tables. These detailed reports are essential for identifying trends and patterns that inform strategic decisions.
Zoho Analytics also empowers you with predictive analytics, which helps in forecasting future trends based on historical data. The tool’s AI-driven insights and automated alerts ensure you stay ahead of potential issues, enhancing investor confidence through transparent and actionable data.
Visualisation techniques in manufacturing have advanced from basic tools to more complex diagrams and analytics. These improvements help investors understand intricate data better.

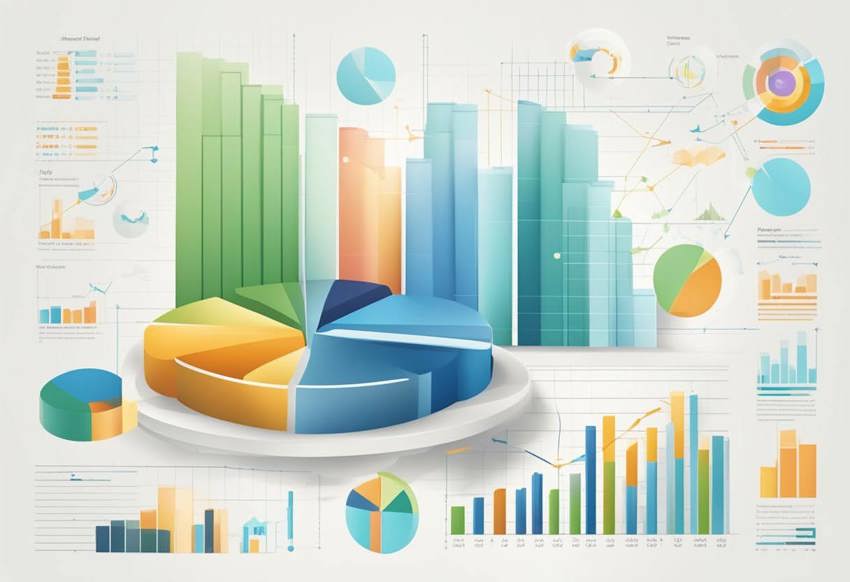
You likely started with basic visual tools such as pie charts and bar charts. These are effective for showing proportions and categories. For instance, a bar chart can illustrate the production rates of different assembly lines.
More complex diagrams like scatter plots and bubble charts allow you to show relationships between multiple variables. In manufacturing, a scatter plot can display the correlation between machine maintenance and production efficiency.
Heat maps and tree maps add depth to visualisations. A heat map can highlight areas of high production costs, making them easier to address. Tree maps benefit you by displaying hierarchical data, such as the breakdown of costs in a multi-stage manufacturing process.
Advanced analytics take visualisation further by integrating deeper data insights. Box-and-whisker plots are ideal for showing the distribution of quality control data, highlighting the spread and identifying any outliers.
Visual analytics tools bring interactivity to your data. They allow you to dig deeper into the numbers, often with the ability to filter and adjust views. This interactivity helps you identify trends and patterns more effectively.
By incorporating advanced analytics into your visualisation toolkit, you can provide more detailed and actionable insights. This capability is crucial for making informed decisions and boosting investor confidence. It not only ensures transparency but also demonstrates the strategic use of data in your operations.
Making informed decisions is crucial in manufacturing. By leveraging advanced analytics tools, you can uncover critical insights that drive strategic planning and operational improvements.
Analytics tools convert raw data into actionable insights, helping you make informed decisions. By focusing on visualisation tools, you can transform complex data sets into easy-to-understand visuals.
Implementing data visualisation tools helps you identify trends and patterns quickly. It enables your team to make data-driven decisions efficiently. Many of these tools offer flexibility and customisation, allowing detailed control over visual elements, which can help you tailor insights to your specific business contexts.
By prioritising analytics and visualisation, you can move from reactive to proactive decision-making, fostering innovation and efficiency in your manufacturing operations.
Interactive data visualisations significantly enhance user engagement by turning passive data consumption into an active exploration process. Through dynamic tools, users can interact with the data, leading to better insights and more informed decisions.
Dynamic and interactive data visualisations enable users to explore data in a more meaningful way. Tools like drag-and-drop features, click interactions and hover effects allow users to delve deeper into complex datasets easily.
These visualisations adjust in real-time to user inputs, making data exploration both intuitive and engaging. For example, an interactive dashboard with filters and sliders can help you narrow down data points, uncover trends and spot anomalies quickly.
Manufacturers can benefit from these tools by gaining a clearer understanding of production metrics and operational efficiency. By transforming static charts into a more dynamic experience, you can make data a tool for discovery rather than just a reporting mechanism.
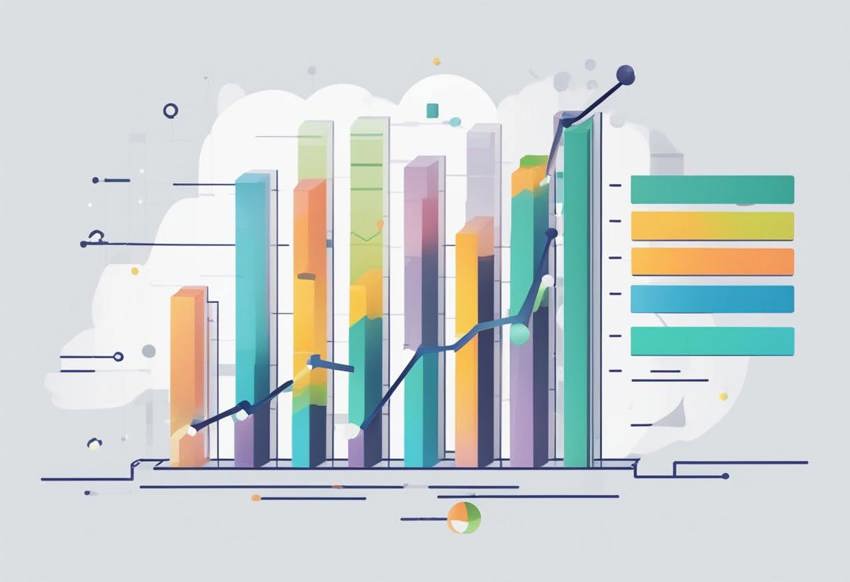
Interactive charts play a critical role in enabling informed decisions. They offer features like zooming, panning and real-time updates, making it easier to understand intricate data relationships and patterns.
When you use interactive charts, you can quickly identify key insights that might be missed with static graphs. For instance, manufacturing managers can adjust their strategies by monitoring real-time production data and comparing it with historical performance through interactive visualisations.
These tools facilitate collaboration, as stakeholders can explore the data together, annotate findings, and share insights seamlessly. This interactive engagement is essential in driving more strategic, data-driven decisions that enhance productivity and operational efficiency.
Cloud-based solutions and real-time analytics are transforming data visualisation in manufacturing. These technologies help businesses gain instant insights, adapt quickly and make data-driven decisions.

Cloud services offer scalable and flexible solutions for business intelligence. You can easily adjust resources as your company grows without the need for extensive hardware. This reduces costs and ensures that IT systems remain current.
With cloud services, you can access data from anywhere, fostering collaboration and quick decision-making. Security features offered by providers like Amazon Web Services (AWS) and Microsoft Azure ensure that your data is protected, meeting compliance standards.
Cloud platforms integrate seamlessly with BI tools. Platforms like Dynamics 365 Business Central and Power BI enable real-time data streams, offering up-to-the-minute analysis. These integrations enhances the ability to monitor operations and improve overall performance.
Modern tools provide real-time analytics, allowing you to monitor manufacturing processes as they happen. This capability enables you to immediately respond to any issues, minimising downtime and improving efficiency.
Real-time data visualisation tools present the freshest data. This allows you to track performance indicators and make informed decisions rapidly. These tools also provide alerts for any irregularities, enhancing operational oversight.
Real-time analytics also support predictive maintenance, which is essential for manufacturers. By analysing data continuously, you can predict when equipment might fail and schedule maintenance proactively. This prevents costly breakdowns and extends equipment life.
It's crucial to address the barriers that organisations face with visualisation literacy. By focusing on educating business teams effectively and selecting the appropriate visualisation tools, you can significantly enhance understanding and decision-making.
Ensuring your business teams are well-versed in data visualisation is key to successful projects. Offering training programmes tailored to their needs helps bridge the knowledge gap.
Workshops and seminars can introduce team members to the basics of visualisation literacy, showing them how to interpret different data charts and graphs accurately. These sessions should be interactive, allowing participants to practise creating and analysing visualisations.
Online courses are another effective way to boost skills. Platforms like DataCamp provide modules specifically designed to improve data and visualisation literacy. Consistently updating these skills is vital as new tools and techniques emerge.
Moreover, appealing visualisations are essential. When team members understand how to craft visually engaging and informative graphics, they can communicate insights more effectively to stakeholders. This not only improves project outcomes but also boosts investor confidence.
Selecting the right visualisation tools and options is critical. Not all charts or graphs are suitable for every type of data. For instance, bar charts are excellent for comparing different categories, while line charts are ideal for showing trends over time.
Integrating visualisation tools with your existing systems ensures seamless data workflows. Tools that adapt and mesh well with your current databases and software systems can save time and reduce errors. They enable a more consistent and reliable data analysis process.
Using tools that offer a range of visualisation options is beneficial. They allow you to tailor your data presentation to the audience's needs. For example, dashboards with interactive elements can provide deeper insights, enabling investors to explore data more thoroughly.
When you choose effective visualisation options, you enhance the clarity of your data. This makes it easier for all stakeholders, including investors, to understand and act on the information, ultimately driving better business outcomes.
Advanced data visualisation tools, combined with artificial intelligence and robust analytics, enhance your strategic business analysis. The integration of such technologies ensures streamlined processes and well-informed business plans.

Artificial intelligence (AI) can revolutionise your business process improvement efforts. By leveraging AI, you can automate repetitive tasks, identify inefficiencies and predict outcomes with high accuracy.
AI-driven tools analyse vast amounts of data faster than traditional methods, providing you with real-time insights. This technology helps in optimising supply chains, enhancing production schedules and reducing downtime via predictive maintenance.
Design principles in AI tools focus on usability and integration with existing systems. For example, incorporating predictive analytics into your workflow allows you to anticipate maintenance needs and avoid production halts. These AI capabilities directly contribute to improving your bottom line by ensuring more efficient operations.
Adopting advanced analytics solutions is crucial for developing a robust business plan. These solutions provide detailed insights into market trends, customer behaviour and financial performance. Tools like Tableau, Power BI and Sisense offer user-friendly interfaces and support a range of visual styles, making complex data easily understandable.
By integrating analytics into your project management, you can make data-driven decisions that align with your strategic goals. These tools help identify growth opportunities, monitor project progress and allocate resources effectively. Incorporating analytics solutions into your planning process ensures that your business plans are grounded in accurate, comprehensive data.
Additionally, leveraging these tools enables better forecasting and trend analysis, allowing you to stay ahead of market changes and make informed decisions. This proactive approach helps in crafting a strategic direction that is both resilient and adaptive to market dynamics.
In this section, we address common queries about the significance and applications of data visualisation tools in manufacturing, particularly how they enhance investor confidence and support decision-making.
Data visualisation tools provide clear, easily interpretable visuals that help investors understand complex data. By presenting financial figures, performance metrics and projections in a visual format, you're being completely transparent, thereby boosting investor trust and confidence in your company's operations and future prospects.
Data visualisation tools enable real-time tracking and analysis of production metrics, quality control and supply chain efficiency. This allows you to identify trends, detect issues early and make informed decisions quickly. Improved visibility over operations helps ensure processes run smoothly and efficiently, leading to better overall performance.
These tools can process and display large datasets in a comprehensible format, highlighting essential insights and trends that might be missed in raw data. Features like interactive dashboards and drill-down capabilities allow you to explore specific data points, making it easier to manage vast amounts of information effectively.
While data visualisation tools are powerful, they can sometimes lead to misinterpretation if the data is not represented accurately. Overreliance on flashy visuals can also distract from the actual data quality. Ensuring data integrity and selecting appropriate visual formats will help you avoid these pitfalls.
By providing a clear and concise view of key performance indicators and trends, data visualisation tools help you make strategic decisions based on accurate and timely information. These tools enable scenario analysis, forecast trends, and track progress against goals, ensuring your decisions are grounded in solid data.
When choosing a data visualisation tool, consider its compatibility with your existing data sources, ease of use and scalability. Also, evaluate the tool's ability to customise visuals to fit your specific needs, its support for real-time data and the quality of customer support and training provided by the vendor.

The Autumn brings the second major release of the year for Business Central, as part of the 2 wave annual update cycle. Here we look at the highlight features.

After a recent visit to the Digital Manufacturing 2day event in Coventry and an insightful presentation by Lord Chris Holmes, I thought I would delve a bit deeper into the current AI regulation facing UK industry.

Choosing the right ERP system when moving on from Sage 50 can shape how efficiently your business grows and adapts. If you want advanced features, greater flexibility and easier integration with familiar Microsoft tools, Microsoft Dynamics 365 Business Central is often the stronger option compared to Sage 200. As real-time data insight, automation and scalability are now necessities and not luxuries, your ERP upgrade decision is more important than ever.